
What it is
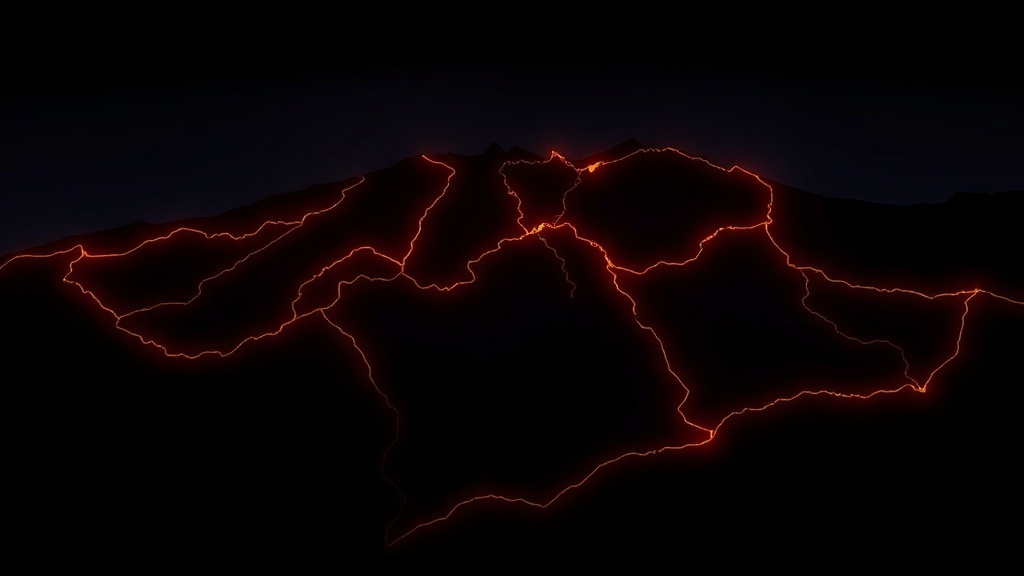
ATS Fire Line renders live United States wildfire operations straight from the National Interagency Fire Center's authoritative WFIGS services: every current incident in the interagency system and every daily fire perimeter, refreshed every five minutes. Incident markers are sized by acres on a log-spaced ramp and colored by percent containment; prescribed (RX) burns draw as cool-teal squares; perimeters get an ember fill with a bloom-glow edge. A per-state filter fed by live counts, minimum-acres chips, a sortable largest-fires board, and glass detail cards (containment, personnel, cause, days burning) complete the operational picture. On build day the services carried roughly 447 incidents, led by the Babylon fire at 104,783 acres.
It runs with an empty .env: the WFIGS feature services are public, keyless, and CORS-open, and the basemap is Esri's anonymous dark-gray vector style.
Not for operational use. Fire Line is a data-visualization demo. It reads public WFIGS mirrors that lag operations and omit local intelligence. It must never be used for evacuation, suppression, or safety decisions — those belong to local emergency management and InciWeb.
The experience
The app opens on the continental United States with Alaska in reach: incident circles glowing by containment state, perimeter polygons pulsing ember at their edges, and a national stat strip — total incidents, total acres, largest fire, fires over 10,000 acres — across the top.
Like every app in the ATS branded line, the interface follows the house standard: React 19 and Tailwind 4 drive a dark glass shell, every control is a Lucide-iconed glass pod designed for this app, and there is no Esri widget chrome anywhere on screen. The map engine is Esri; the experience is ATS — designed, not assembled.
- Operational symbology. Marker size follows IncidentSize on a log-spaced ramp (under 100 acres → 5 px; 100,000+ → 22 px); color follows PercentContained from red at 0% to cool gray at 100%. RX burns are visually distinct teal squares so a prescribed burn never reads as an escaped fire.
- Filters that stay live. The state dropdown is fed by a live group-by on POOState (on build day: California 90, Alaska 58, Oregon 43); minimum-acres chips run All / 100+ / 1k+ / 10k+ / 100k+. Every filter is a definitionExpression update — the layers never rebuild.
- The fires board. Sortable by largest, newest, or most crewed (Aspen Acres topped personnel on build day at 1,930); clicking a row flies to the fire and opens its card.
- Glass detail cards. Acres, a containment progress bar, discovery date and days burning, personnel, cause, county and state, and incident type.
- Five-minute cadence. Layers and stats auto-refresh every five minutes, with a manual refresh pod for the impatient.
The data — where it comes from
Both feature services are live, public, keyless, and CORS-open — verified on build day, including a field-by-field schema check.
| Source | What it provides | Refresh | Cost | Attribution |
|---|---|---|---|---|
| NIFC WFIGS Current Incident Locations (FeatureServer/0) | All current wildland-fire incident points, IRWIN-fed: name, size, containment, personnel, cause, discovery time | Live; app refreshes every 5 min | Free (public) | NIFC / WFIGS; not for operational use |
| NIFC WFIGS Current Interagency Fire Perimeters (FeatureServer/0) | Daily fire-perimeter polygons (133 on build day) with mirrored incident attributes | Live; app refreshes every 5 min | Free (public) | NIFC / WFIGS; not for operational use |
| Esri dark-gray vector basemap | Anonymous legacy vector basemap | Esri-hosted | Free (anonymous) | Esri |
How it was assembled
The application is a fully static single-page app — no backend, no database, no server-side rendering. The stack is the shared ATS Labs branded-app baseline:
Module map — the codebase is small and deliberate; each file owns one concern:
Key engineering decisions
- DailyAcres does not exist — WFIGS renamed it IncidentSize. The build brief's field list was a guess; querying the live schema (?f=json plus sample rows) showed the legacy DailyAcres field is gone. Every acreage readout in the app is IncidentSize on points and poly_GISAcres on perimeter geometry. The standing rule: verify the schema before coding against it.
- Two FeatureLayers on the same URL, so the containment ramp never touches RX burns. Visual variables cannot be scoped per unique value within one renderer — so wildfires (WF plus CX complexes) and prescribed burns are two FeatureLayers over the same service, split by definitionExpression. The size/containment visual variables apply only to the wildfire layer; RX gets its own teal square symbol.
- Null-dominant fields, handled conservatively. PercentContained was null on 311 of 447 rows and IncidentSize on ~18% — visual variables wrap fields in Arcade IIf(IsEmpty(...), 0, ...) so nulls draw as floor-size and uncontained, the operationally conservative reading; sorted queries append IS NOT NULL guards.
- Perimeter glow via a layer effect. The ember edge is layer.effect = "bloom(1.1, 0.4px, 0.05)" — cheap, GPU-side, and it reads beautifully on the dark-gray basemap. Intensity stays near 1, or the whole layer blooms.
- Stats bypass the map. The national overview queries the service's /query endpoint directly (outStatistics plus a POOState group-by) so the stat strip ignores map filters; detail cards requery by OBJECTID because hitTest graphics only carry rendered fields. Geometry queries always pass outSR=4326 — the service's native reference is NAD83 (wkid 4269).