
What it is
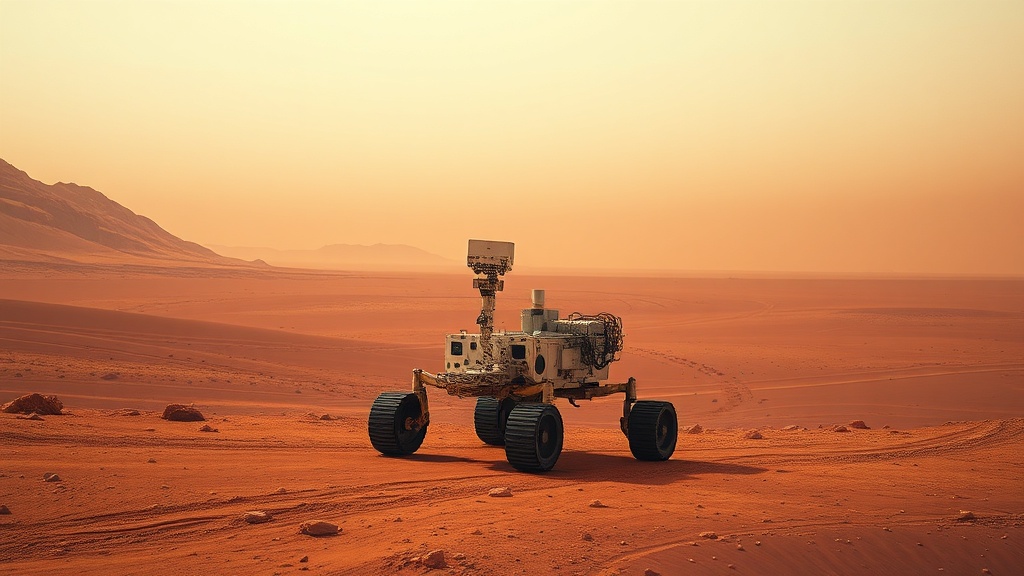
ATS Mars Atlas is an interactive map of another planet. The OpenPlanetaryMap global Mars basemap — NASA MOLA shaded relief blended with the Viking mosaic — is served as standard XYZ tiles and rendered through the ArcGIS Maps SDK; on top of it ride the full NASA/JPL traverses of two active rovers: Perseverance in Jezero Crater (172 waypoints through sol 1913) and Curiosity in Gale Crater (153 waypoints through sol 4950), each with an elevation profile, mission statistics, and click-to-inspect waypoints. A gazetteer of ten famous Mars locations rounds out the tour, and the header keeps a live Mars Sol Date and Coordinated Mars Time (MTC), computed per Allison & McEwen (2000).
It is the odd one out in the ATS Labs portfolio by design: there is no Esri basemap at all — this is Mars — and no Earth assumption survives contact with it. Distances are computed with a Mars-radius haversine rather than the SDK's Earth-ellipsoid tools, tile zoom limits were established empirically rather than taken from documentation, and the traverse files required hand-parsing because they are not quite GeoJSON. The result cross-checks against JPL's own odometry to within about 3%.
The audience is educators, museums and planetariums, space enthusiasts, and — commercially — any prospect who needs proof that ATS's mapping practice extends beyond Esri's Earth stack to arbitrary tiled data with bespoke measurement rules.
The experience
The app opens on the full disk of Mars at zoom 2, ochre and cratered, in a mission-control shell with Mars-rust accents. Two rover chips in the panel show the missions at a glance — Perseverance at sol 1913, Curiosity at sol 4950 — and the header ticks with the live Mars Sol Date and MTC.
Mission stats — traverse length among them — are computed on the fly with the app's own Mars haversine, and agree with JPL's published odometry to within roughly 3%.
- Fly to a rover. One click lands the view on a cyan (Perseverance) or gold (Curiosity) diamond at the rover's latest position, with its full traverse line threading the crater floor behind it.
- Waypoint inspection. Click any waypoint — or the rover diamond itself — for sol, site/drive, odometry, elevation, and coordinates in a glass detail card.
- Elevation profile. A per-rover canvas strip charts elevation along the traverse; the selected waypoint is dotted on the profile, so climbs like Curiosity's ascent out of the crater floor read immediately.
- Gazetteer. Ten famous Mars locations, one click each, for planet-scale sightseeing between rover visits.
The data — where it comes from
All sources are free and public; the rover data is bundled, so the tiles are the only runtime dependency.
| Source | What it provides | Refresh | Cost | Attribution |
|---|---|---|---|---|
| OpenPlanetaryMap Mars basemap v0.2 (CARTO-served XYZ tiles) | Global Mars basemap: NASA MOLA shaded relief + Viking mosaic; native detail to ~z8, usable through z10 | Static published tile set | Free (public) | Credit OpenPlanetaryMap; underlying data NASA |
| NASA/JPL MMGIS — Mars 2020 localization (bundled m20_path.json) | Perseverance: 172 waypoints plus traverse line, through sol 1913 | Bundled snapshot; refreshed by re-downloading from MMGIS | Free (public) | NASA/JPL |
| NASA/JPL MMGIS — MSL localization (bundled msl_path.json) | Curiosity: 153 waypoints plus traverse line, through sol 4950 | Bundled snapshot, as above | Free (public) | NASA/JPL |
| Allison & McEwen (2000) areocentric solar coordinates | Algorithm for the live Mars Sol Date + MTC clock (computed client-side; not a service) | Continuous, client-side | Free | Cite Allison, M. & McEwen, M. (2000) |
How it was assembled
The application is a fully static single-page app — no backend, no database, no server-side rendering. The stack: TypeScript, ArcGIS Maps SDK for JavaScript 5.0.x, Calcite Design System 5.0.x, and Vite 8.
Module map — the codebase is small and deliberate; each file owns one concern:
Key engineering decisions
- Mars on a Mercator tile scheme — eyes open. OPM serves Mars in the standard XYZ web-mercator tiling scheme, so rover and landmark coordinates are declared wkid 4326 and project exactly as Earth coordinates would — which is correct here, because OPM and NASA's MMGIS built the tiles under the same convention, and overlays align. But the datum is areocentric, not WGS84: every Earth-aware measurement tool (geodesicLength, geometryEngine.geodesic*, geodesic Circles) is wrong on this map and is deliberately avoided. Distances use a Mars haversine with R = 3,389.5 km, which reproduces JPL odometry to ~3%.
- Empirical zoom bounds. The tile endpoint returns HTTP 200 at every zoom level tested (through z12), so status codes cannot bound the pyramid. Pixel-diversity probing showed real detail through z10 and flat upsampled color beyond; view constraints are set to minZoom 2 / maxZoom 10 (native detail ends ~z8).
- Hand-parsed traverse files. The MMGIS files are not plain GeoJSON — a top-level rover string and a traverse MultiLineString feature sit beside the features array. They are fetched and parsed manually into Graphics; feeding them to GeoJSONLayer would drop the traverse and choke on the extra keys. Each MultiLineString maps 1:1 onto a single Polyline's paths.
- Small sharp edges. @arcgis/core's Map module shadows the global Map (use globalThis.Map for collections); setting canvas.width resets the 2D context transform, so the device-pixel-ratio scale is reapplied on every profile redraw; Calcite segmented controls move their visual selection via the checked attribute, not the value property.