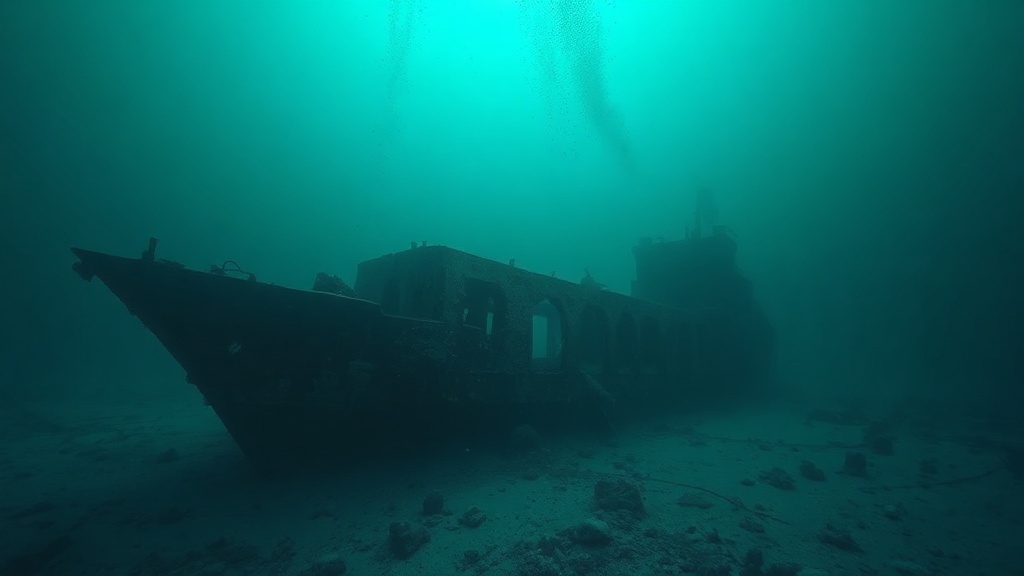

What it is
ATS Ghost Fleet puts every charted shipwreck and obstruction in U.S. waters on a single map: 12,660 point features from NOAA's AWOIS (Automated Wreck and Obstruction Information System) database, bundled with the app as a dated snapshot and explored over the Esri Oceans basemap, whose bathymetry does the visual storytelling. The chrome is nautical-noir — ghost-cyan wrecks, amber obstructions, an ink-dark shell.
Its distinction is under the hood: every filter runs through SQL definitionExpressions — first against the source service, now against the bundled snapshot via the ArcGIS SDK's client-side query engine, which implements the same standardized SQL — including a depth-range slider that normalizes feet, meters, and fathoms to feet inside the WHERE clause itself, and a text search that scans vessel names and the raw survey-history narratives together. A live count chip tracks every active filter, a density heatmap toggle reveals where the seafloor is most crowded, and a 'notable wrecks' list surfaces the 110 named vessels with a recorded sinking year — USS New Jersey and USS Virginia (spelled VIRGINA in the AWOIS record), sunk in Billy Mitchell's 1923 aerial-bombing demonstration, both make the cut.
It rewards marine historians, wreck divers, coastal researchers, and anyone who enjoys primary-source narratives — each record carries the original AWOIS survey logbook text. It is also, for ATS, the reference demonstration of a query-smart front end that runs the same SQL whether the records live in a hosted service or in a file shipped with the app.
The experience
On load, roughly 12,600 dots wash across the oceans basemap and the count chip reads "12,660 of 12,660". From there, every control narrows the fleet — and the chip follows:
The custom popup presents a fielded table — depth, position quality, chart number, year sunk — with graceful handling of the many nulls in a 12,660-record archival file, followed by the raw AWOIS survey-history narrative, reproduced as the surveyors wrote it.
- Wreck / obstruction segmenting. A segmented control splits the file: choose Obstructions and the chip drops to 6,402.
- Text search. One search box scans both vessel names and the survey-history narratives, so "submarine" or a vessel name both work.
- 'Has recorded story' toggle. Keeps only records whose survey narrative is substantive rather than a placeholder stub.
- Depth-range slider. Filters by charted depth regardless of whether the source record was measured in feet, meters, or fathoms — the units are normalized in the SQL.
- Notable wrecks. Named vessels with a recorded sinking year, ranked by the richness of their survey narrative; clicking one flies the map there and opens the popup.
- Density heatmap. A toggle swaps the class renderer for a heatmap to show concentration — harbor approaches and graveyard coasts light up immediately.
The data — where it comes from
The wreck data ships with the app as a dated file; only the basemap and the 3D elevation surface come over the wire.
Data-currency caveat: NOAA's Office of Coast Survey retired AWOIS — it is no longer updated and the AWOIS service has been taken down (see https://www.nauticalcharts.noaa.gov/data/wrecks-and-obstructions.html) — so this is a frozen snapshot read on 2026-09-28 and bundled here for provenance; mariners should use NOAA's ENC Direct for current charted wrecks. Positions inherit the original AWOIS quality codes (High / Med / Low / Poor). Not for navigation.
| Source | What it provides | Refresh | Cost | Attribution |
|---|---|---|---|---|
| NOAA AWOIS — dated snapshot bundled with the app (public/data/awois-2026-09.geojson, read 2026-09-28) | 12,660 wreck/obstruction points: record number, vessel term, depth + sounding type, position quality, chart, year sunk, survey-history narrative | Frozen — NOAA retired AWOIS and no longer updates it; histories end in the early 2010s and yearSunk tops out at 2009. Current charted wrecks live in NOAA ENC Direct | Public domain (US federal work) | Credit NOAA Office of Coast Survey / AWOIS (retired database, no longer updated; snapshot 2026-09-28); not for navigation |
| Esri Oceans basemap (anonymous) | Bathymetric base that gives the wrecks their context | Vendor-managed | Esri public basemap service | Esri attribution renders in-map automatically |
How it was assembled
The application is a fully static single-page app — no backend, no database, no server-side rendering. The stack: TypeScript, ArcGIS Maps SDK for JavaScript 5.1, Calcite Design System 5, and Vite 8.
Module map — the codebase is small and deliberate; each file owns one concern:
Key engineering decisions
- Schema forensics before code. The service schema was verified at build time (layer JSON plus sampled queries, 2026-07-12). The pivotal finding: vesselTerm doubles as vessel name and classifier — 'OBSTRUCTION' (6,402), 'UNKNOWN' (3,608), and roughly 2,416 real vessel names share one field, and no featureType field exists on this snapshot. The renderer therefore classifies with an Arcade valueExpression rather than a raw field.
- One SQL dialect, two engines. The filters were written as standardized SQL against the source service (CHAR_LENGTH(), UPPER(), and arithmetic, all verified with returnCountOnly probes). The ArcGIS SDK implements the same functions client-side, so when the data was frozen into a bundled snapshot the WHERE-clause builder did not change a character — the depth slider still normalizes feet, meters, and fathoms to feet inside the SQL (e.g. depth * 3.28084), and the counts match the service's to the record.
- A meaningful 'has story' filter. A naive history-not-empty test passes 12,567 of 12,660 records — useless. The toggle uses CHAR_LENGTH(history) > 30 to drop blank and 'No History.' stubs.
- Notable-wrecks ranking. The pool is named vessels with yearSunk > 0 — 110 rows, retrieved in a single query — then ranked client-side by cleaned narrative length (the 254-character field truncation makes raw length server-side ranking misleading).
- Heatmap honesty. Switching to the HeatmapRenderer also disables popups: hit-testing against heatmap pixels never resolves a feature, so leaving popups on would make clicks silently no-op.
- Racing the typist. The count chip sequence-guards its queryFeatureCount responses; fast typing can otherwise return stale counts out of order.