
What it is
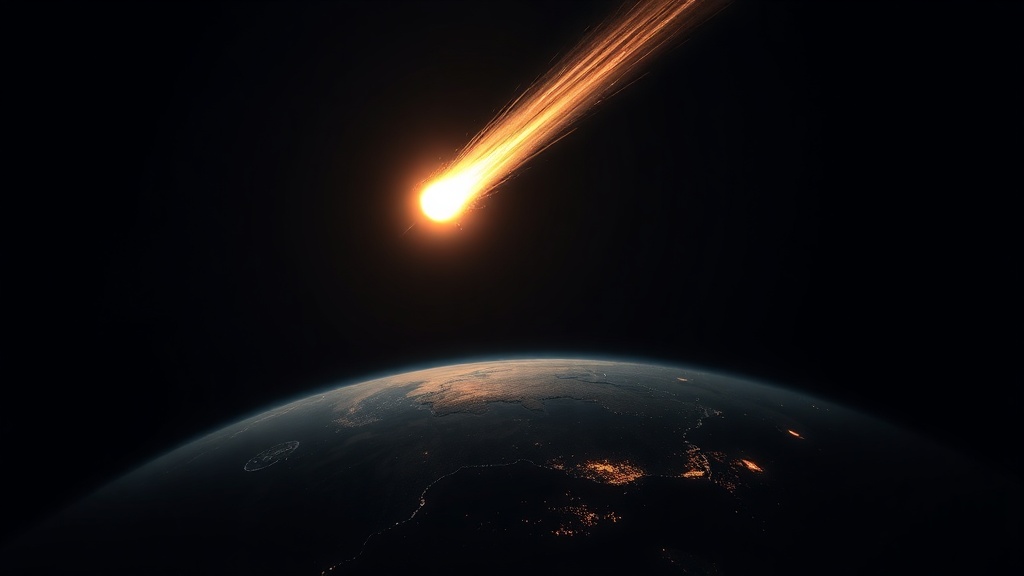
ATS Impact Watch maps two records of the same phenomenon on one dark globe: the ground truth and the near misses. All 190 confirmed impact craters in the English Wikipedia list (CC BY-SA 4.0) appear as rust-orange circles sized by rim diameter, up to Vredefort's 160 km. Sharing the map are 878 atmospheric fireballs detected by US Government sensors since 1988 and published by NASA/JPL CNEOS, rendered as cyan-white glow points sized by impact energy up to the 441-kiloton Chelyabinsk superbolide of 2013. Chicxulub — the dinosaur-extinction impact — carries a pulsing marker of honor in the Yucatán.
The interface gives each population its own controls: a Craters / Fireballs / Both layer toggle, logarithmic minimum-size sliders with live match counts, and Top-10 lists (largest craters, most energetic fireballs) that fly the map to each feature. A fireballs-per-year timeline histogram re-renders as the energy filter changes. Clicking any feature opens a detail card — crater ages formatted from the database's free-text strings ("2,023 Ma", "<70 Ma"), fireball energies expressed in Hiroshima-bomb equivalents when they reach 15 kt.
The app is fully static and uses no credentials. The CNEOS Fireball API is not CORS-enabled, so the fireball data ships as a bundled snapshot taken 2026-07-12 — a deliberate architectural choice that keeps the application serverless.
The experience
At load the map is already telling the story: a dense cyan field of fireballs across every ocean and continent, 190 orange crater circles, and Chicxulub pulsing on the Yucatán coast. The controls are built for the questions people actually ask:
- Toggle the populations. Craters, Fireballs, or Both — each with its own visual language (rust-orange geology versus cyan-white atmosphere), so the two datasets never blur together.
- Filter on log scales. Minimum crater diameter and minimum fireball energy sliders run on logarithmic scales with live counts — both distributions are heavily right-skewed, so linear sliders would waste most of their travel on a handful of giants.
- Jump to the record-holders. Top-10 lists for the largest craters and the most energetic fireballs fly the map to each feature and open its card — with Chelyabinsk (441 kt, the only event labeled by name) leading the fireball list.
- Read the timeline. A fireballs-per-year canvas histogram draws filtered counts bright over total counts dim, redrawing on every filter change — the growing sensor record since 1988 is visible at a glance.
- Open a detail card. Craters show location, diameter, formatted age and coordinates, with a link to the crater’s Wikipedia article; fireballs show date, energy, altitude and velocity, with Hiroshima equivalents for events of 15 kt and up.
The data — where it comes from
Two bundled scientific datasets and one anonymous Esri basemap.
| Source | What it provides | Refresh | Cost | Attribution |
|---|---|---|---|---|
| English Wikipedia, “List of impact craters on Earth” (CC BY-SA 4.0) + Wikidata (CC0) for coordinates — retrieved 2026-09-28 (bundled impact-craters.geojson) | 190 confirmed impact structures: name, country, region, rim diameter, age, Wikipedia article title, Wikidata QID | Static — bundled snapshot | Free | Wikipedia contributors (CC BY-SA 4.0) and Wikidata (CC0); originally compiled by the Earth Impact Database (PASSC) |
| NASA/JPL CNEOS Fireball Data API (bundled fireballs.json) | 878 atmospheric fireball events since 1988: date, impact energy, location, altitude, velocity | Snapshot 2026-07-12 — the API serves no CORS headers, so the app bundles rather than fetches | Free | NASA/JPL CNEOS; reported by US Government sensors — energies are estimates |
| Esri dark-gray vector basemap (anonymous) | Dark world basemap under both layers | Vendor-managed | Free (no API key) | Esri attribution renders in-map automatically |
How it was assembled
The application is a fully static single-page app — no backend, no database, no server-side rendering. The stack: TypeScript, ArcGIS Maps SDK for JavaScript 5.1, Calcite Design System 5.1, and Vite 8.
Module map — the codebase is small and deliberate; each file owns one concern:
Key engineering decisions
- Log-scale sliders, because the data demands them. Crater diameters span 0.01–160 km and fireball energies 0.04–450 kt — both heavily right-skewed. Slider positions 0–100 map through a log scale to the filter threshold (position 0 short-circuits to "no filter"), and marker sizes use the same log mapping: craters 1.2–40 px, fireballs 3–30 px.
- Fireball parsing is all edge case. CNEOS rows are positional arrays of strings — numbers included — and any cell may be null. Latitude and longitude arrive unsigned with separate hemisphere columns, so the sign is applied from lat-dir (S → negative) and lon-dir (W → negative). Altitude is null on 286 rows and velocity on 519 — rendered as "—", never as zero. The 441 kt maximum is Chelyabinsk (2013-02-15 03:20:26), the one event special-cased by date so it can be labeled by name.
- Crater ages are free text, parsed honestly. The source age field mixes "2023 ± 4", "<70", "~443-470" and "-". formatAge() keeps the < and ~ qualifiers, drops the ± uncertainty, comma-groups values of 100 Ma and up ("2,023 Ma"), preserves ranges ("~443–470 Ma"), keeps sub-10 Ma values verbatim (sub-million-year precision matters), and maps "-" to "Age unknown".
- Glow without click interference. Each fireball is two graphics — a translucent 2.4× halo on a layer below the cores — and only the core layer participates in hit-testing, so halos never swallow clicks. The Chicxulub pulse is a single graphic replaced every 90 ms on its own layer, gated on layer visibility and the diameter filter — cheap, with no per-graphic geometry mutation.
- Bundled by necessity, serverless by design. The CNEOS API has no CORS, so the app never attempts a live fetch — the snapshot is refreshed offline instead, and the constraint became the architecture: fully static, zero moving parts. SDK 5.x and Calcite 5 specifics (attribution handling, asset path before defineCustomElements(), calciteSliderInput and segmented-control events) follow the portfolio conventions.