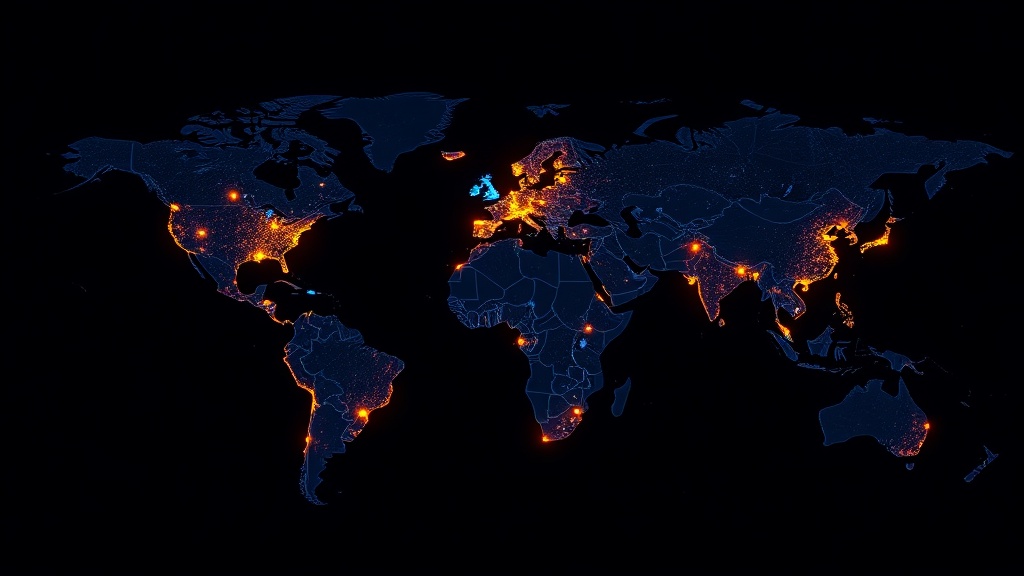

What it is
ATS Power Atlas draws the world's power infrastructure on one dark map: 34,936 power plants across 167 countries from the WRI Global Power Plant Database v1.3, every one colored by fuel and sized by installed capacity on a square-root scale — so dot area tracks megawatts. A live client-side energy-mix panel shows capacity or plant-count share by fuel, globally or for any single country; a renewables callout reports 27.2% of the 5.71 TW of listed capacity; and a Giants list flies to the top 12 plants, led by Three Gorges Dam at 22.5 GW.
The dataset is bundled (2.4 MB) and the basemap anonymous, so the app runs with an empty .env and makes no live requests. The interesting engineering is in scale and honesty: making 34,936 points fluid in a browser, computing statistics without ever flickering, and being explicit that the WRI database is a ~2021 snapshot — the shape of the global fleet, not a live registry.
The audience is energy analysts, ESG and sustainability teams, educators — and any prospect who needs to see tens of thousands of features filtered and summarized without a backend.
The experience
The app boots to the full world: ten thousand solar-gold points swarming across every continent, hydro blue along the rivers, coal gray across the industrial belts, and the brand lockup reading "34,936 plants · 167 countries · WRI v1.3".
Like every app in the ATS branded line, the interface follows the house standard: React 19 and Tailwind 4 drive a dark glass shell, every control is a Lucide-iconed glass pod designed for this app, and there is no Esri widget chrome anywhere on screen. The map engine is Esri; the experience is ATS — designed, not assembled.
- Twelve-fuel cartography. A UniqueValueRenderer with the brand fuel palette — Solar gold, Wind cyan, Hydro blue, Gas violet, Coal gray, and seven more — plus a capacity size variable from 3 to 20 px. The census: Solar 10,665 · Hydro 7,156 · Wind 5,344 · Gas 3,998 · Coal 2,330 · Oil 2,320 · Nuclear 195.
- The energy mix — the signature panel. A stacked bar computed instantly from the raw array: capacity ⇄ count toggle, per-fuel shares (globally, roughly Coal 34% · Gas 26% · Hydro 18% · Nuclear 7.1% of capacity), and the renewables-share callout — recomputed live for any country or capacity filter.
- Filters that compose. Multi-select fuel chips with live counts, capacity floor chips (All / 100 MW+ / 500 MW+ / 1 GW+ — the last showing 1,618 plants), and a type-ahead country search over 167 countries.
- Giants. The top 12 plants by capacity; each click flies to the site with a gold selection ring and a detail card carrying fuel, MW/GW, and commissioning year when known.
- Pods. Home, renewables-only, and fossil-only one-click views.
The data — where it comes from
One bundled dataset plus the anonymous basemap — no live requests at all.
| Source | What it provides | Refresh | Cost | Attribution |
|---|---|---|---|---|
| WRI Global Power Plant Database v1.3.0 | 34,936 plants across 167 countries: name, country, capacity (MW), primary fuel, coordinates, commissioning year (~half of records) | Bundled snapshot — final release, June 2021 | Open data, CC BY 4.0 | World Resources Institute, CC BY 4.0 |
| Esri dark-gray vector basemap | Anonymous legacy vector basemap | Esri-hosted | Anonymous, no key | Esri |
How it was assembled
The application is a fully static single-page app — no backend, no database, no server-side rendering. The stack is the shared ATS Labs branded-app baseline:
Module map — the codebase is small and deliberate; each file owns one concern:
Key engineering decisions
- 34,936 points as a client-side FeatureLayer, never a GraphicsLayer. The layer is constructed from in-memory graphics (new FeatureLayer({ source, fields, objectIdField, renderer })), which hands the points to the SDK's WebGL feature pipeline — fluid pan and zoom at full count, where a GraphicsLayer drags badly at this scale. The bonus: every filter is a single definitionExpression swap (fuel set, capacity floor, country) — instant, with zero graphic churn.
- Dot area tracks megawatts: an Arcade square-root size variable. Sizing uses valueExpression: "Sqrt($feature.capacity_mw)" mapped from data value 1–150 onto 3–20 px — 150 being the square root of 22,500 MW, i.e. Three Gorges Dam at 22.5 GW (verified against the dataset). A helper in App.tsx mirrors the same ramp so the gold selection ring always matches its dot.
- Single-pass statistics, never layer queries. Every stat — the strip, the mix bar, chip counts — comes from one synchronous pass over the raw 34,936-row array in computeStats(), which is sub-millisecond; async layer queries would flicker the mix bar on every chip click. Two scopes are computed per filter change: one with all filters (the stat strip) and one with the fuel filter excluded (the mix bar — otherwise a solar-only filter would read "100% solar").
- Fifteen WRI fuels, twelve buckets. The long tail (Cogeneration, Petcoke, Wave and Tidal) folds into "Other" at load, so the renderer, legend, and mix bar share one 12-value vocabulary.
- Vintage honesty as a design rule. v1.3.0 (June 2021) is WRI's final release. The app never presents it as current: the post-2021 solar and wind build-out is absent, "renewables share" is explicitly share of listed capacity (not generation), and the footer and README wording is deliberate. Roughly half the records (17,489) carry no commissioning year — the detail card hides the row rather than showing a dash.